


-
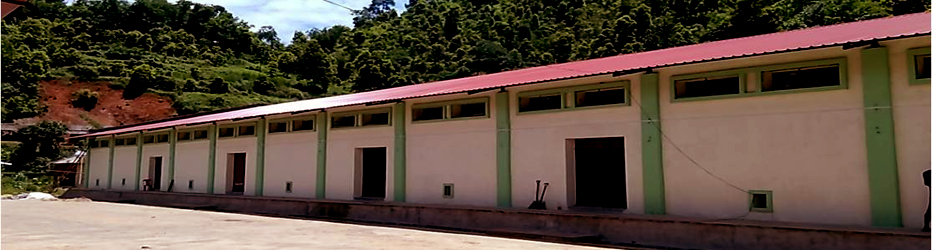
Khanapara Warehousing Complex, At Khanapara Ri-Bhoi. Godown Capacity 5000 MT
-
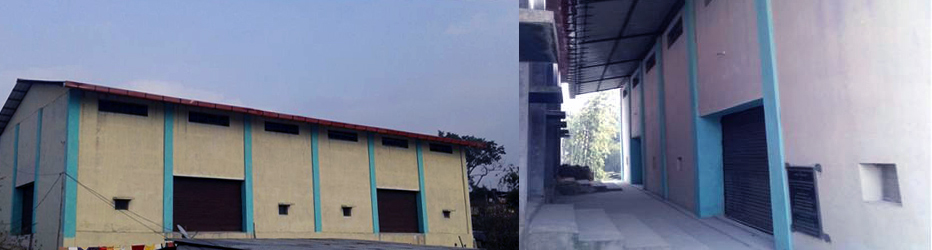
Shillong Warehousing Complex, At Mawlai
-
Khanapara Warehousing Complex, At Khanapara Ri-Bhoi
Financial Performance of the Meghalaya State Warehousing Corporation
Highlights of the financial performance and the progress made by the Corporation are mentioned below:-
Financial Report Income
| Year | Warehouse Charges | Interest | Other Income | Managerial Subsidy | Total |
|---|---|---|---|---|---|
| 2024-25 | Rs. 1,29,51,048/- |
Rs. 70,19,014/- |
Rs. 78,140/- |
- |
Rs. 2,00,48202/- |
| 2023-24 | Rs. 1,17,81,885/- |
Rs. 54,98,594/- |
Rs. 61,872/- |
- |
Rs. 1,73,42,351/- |
| 2022-23 | Rs. 1,18,23,987/- |
Rs. 39,35,631/- |
Rs. 93,964/- |
- |
Rs. 1,58,53,582/- |
| 2021-22 | Rs. 1,03,15,952/- |
Rs. 31,95,486/- |
Rs. 24,787/- |
- |
Rs. 1,35,36,225/- |
| 2020-21 | Rs. 1,03,75,479/- |
Rs. 39,27,971/- |
Rs. 22,997/- |
- |
Rs. 1,43,26,447/- |
| 2019-20 | Rs. 1,01,50,690/- |
Rs. 37,21,465/- |
Rs. 72,719/- |
- |
Rs. 1,39,44,874/- |
| 2018-19 | Rs. 89,14,165.00 |
Rs. 34,24,815.00 |
Rs. 12,259.00 |
Rs. 5,00,000.00 |
Rs. 1,28,51,239.00 |
| 2017-18 | Rs. 91,93,784.00 |
Rs. 12,45,332.00 |
Rs. 58,026.00 |
Rs. 12,00,000.00 |
Rs. 1,16,97,142.00 |
| 2016-17 | Rs. 78,09,780.00 |
Rs. 12,60,231.00 |
Rs. 43,118.00 |
Rs. 9,47,000.00 |
Rs. 1,00,60,129.00 |
| 2015-16 | Rs. 58,41,367.00 |
Rs. 13,01,382.00 |
Rs. 11,002.00 |
- |
Rs. 71,53,751.00 |
| 2014-15 | Rs. 47,36,563.00 |
Rs. 12,90,632.00 |
Rs. 36,613.00 |
- |
Rs. 60,63,808.00 |
| 2013-14 | Rs. 33,78,791.00 |
Rs. 10,26,621.00 |
Rs. 10,100.00 |
- |
Rs. 44,15,512.00 |
| 2012-13 | Rs. 32,27,249.00 |
Rs. 17,51,835.00 |
Rs. 26,900.00 |
- |
Rs. 50,05,984.00 |
Expenditure
| Year | Establishment | Depreciation on fixed Assets | Total | Profit / Loss |
|---|---|---|---|---|
| 2024-25 | Rs. 1,20,84,524/- |
Rs. 14,87,255.36 |
Rs. 14,87,255.36 |
(+) Rs. 64,76,422.64 |
| 2023-24 | Rs. 99,96,184/- |
Rs. 13,46,656.78 |
Rs. 1,13,42,840.78 |
(+) Rs. 59,99,510.22 |
| 2022-23 | Rs. 92,52,948/- |
Rs. 12,27,893.53 |
Rs. 1,04,80,877.53 |
(+) Rs. 53,72,704.47 |
| 2021-22 | Rs. 80,40,310.56 |
Rs. 6,14,796.82 |
Rs. 86,55,107.38 |
(+) Rs. 48,81,117.62 |
| 2020-21 | Rs. 74,70,101/- |
Rs. 5,39,422.77 |
Rs. 80,09,523.77 |
(+) Rs. 63,16,923.23 |
| 2019-20 | Rs. 71,27,551/- |
Rs. 5,55,225.46 |
Rs. 76,82,775.46 |
(+) Rs. 62,62,098.54 |
| 2018-19 | Rs. 89,00,860.68 |
Rs. 5,79,554.34 |
Rs. 94,80,415.02 |
(+) Rs. 33,70,823.98 |
| 2017-18 | Rs. 87,86,782.60 |
Rs. 7,06,907.56 |
Rs. 94,93,690.16 |
(+) Rs. 22,03,451.84 |
| 2016-17 | Rs. 77,01,061.50 |
Rs. 7,02,637.20 |
Rs. 84,03,698.70 |
(+) Rs. 16,56,430.30 |
| 2015-16 | Rs. 62,29,027.20 |
Rs. 6,67,853.75 |
Rs. 68,96,880.95 |
(+) Rs. 2,56,870.05 |
| 2014-15 | Rs. 59,01,000.70 |
Rs. 7,69,325.68 |
Rs. 66,70,326.38 |
(-) Rs. 6,06,518.38 |
| 2013-14 | Rs. 49,99,165.55 |
Rs. 6,50,955.76 |
Rs. 56,50,121.31 |
(-) Rs.12,34,609.31 |
| 2012-13 | Rs. 43,24,077.55 |
Rs. 5,39,226.48 |
Rs. 48,63,304.03 |
(+) Rs. 1,42,679.97 |